X 8.4.AP-4
Question Help
The table below shows the average temperature in a particular city...

Mathematics, 23.04.2021 23:30 tushema1
X 8.4.AP-4
Question Help
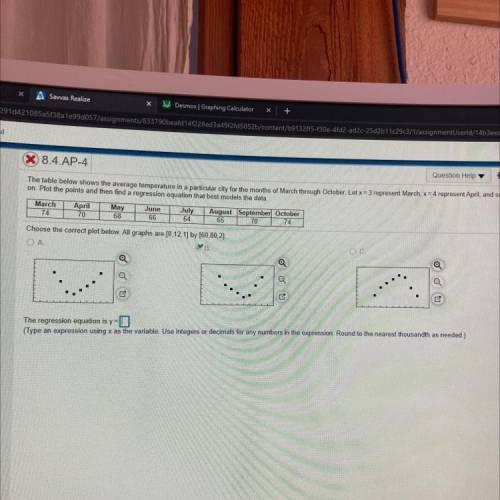
The table below shows the average temperature in a particular city for the months of March through October. Let x= 3 represent March, x = 4 represent April, and so
on. Plot the points and then find a regression equation that best models the data.
March April May June July August September October
74 70 68 66 64 65 70 74
Choose the correct plot below. All graphs are [0,12,1] by [60,80,2).
OA.
B.
OC.
Q
a
Q
a
The regression equation is y=0
(Type an expression using x as the variable. Use integers or decimals for any numbers in the expression Round to the nearest thousandth as needed.)

Answers: 1


Another question on Mathematics
Mathematics, 21.06.2019 17:00
The perimeter of a movie screen is 54 meters. the screen is 18 meters wide. how tall is it?
Answers: 1
Mathematics, 21.06.2019 21:30
Ihave a triangle with a 60 degree angle. lets use d for that angle. what are the values of e and f if d is 60 degrees? and what do you notice about the values of e and f?
Answers: 2
You know the right answer?
Questions

English, 31.08.2019 15:30

History, 31.08.2019 15:30

Mathematics, 31.08.2019 15:30
History, 31.08.2019 15:30
Mathematics, 31.08.2019 15:30

Health, 31.08.2019 15:30

Geography, 31.08.2019 15:30

Spanish, 31.08.2019 15:30

Biology, 31.08.2019 15:30

Business, 31.08.2019 15:30


