Mathematics, 29.04.2021 15:30 aparedes5
HELP ME PLEASE!!! I suck at math ;-;
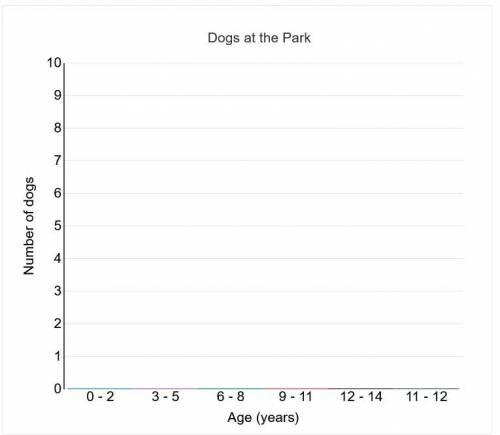
The data shows the age of eight different dogs at a dog park.
3, 3, 7, 2, 4, 8, 10, 8
Create a histogram of this data.
To create a histogram, hover over each age range on the x-axis. Then click and drag up to plot the data.


Answers: 3


Another question on Mathematics

Mathematics, 21.06.2019 14:00
You are assembling pieces of an iron gate to complete a fence. the finished gate will look like the one below. in order to assemble the gate it is important to under how the pieces are related. part 1: how are pies 1 and 2 in the archway related? part 2: how are the rectangular sections 5 and 6 in the center of the gate related to each other?
Answers: 1

Mathematics, 21.06.2019 15:00
In a circle, a 45° sector has an area of 32π cm2. what is the radius of this circle? 32 cm 12 cm 16 cm 8 cm
Answers: 3

Mathematics, 21.06.2019 15:20
Compare the subtraction problems 6/8 - 5/8 = 1/8 and 6/9 - 7/9 = 1/9 why is the answer to the first problem positive and the answer to the second problem negative
Answers: 1

Mathematics, 21.06.2019 19:30
Julian wrote the following numeric pattern on the board3,10,17,24,31,38.what numbers of julian's pattern are compound numbers.
Answers: 2
You know the right answer?
HELP ME PLEASE!!! I suck at math ;-;
The data shows the age of eight different dogs at a dog park....
Questions


History, 21.11.2021 14:00


Mathematics, 21.11.2021 14:00


Computers and Technology, 21.11.2021 14:00


Arts, 21.11.2021 14:00

Social Studies, 21.11.2021 14:00


