HELP ASAP
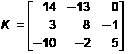
The data below are the number of beds in a sample
of 15 nursing homes in New Mexico...

Mathematics, 12.05.2021 04:00 taylor511176
HELP ASAP
The data below are the number of beds in a sample
of 15 nursing homes in New Mexico in 1988.
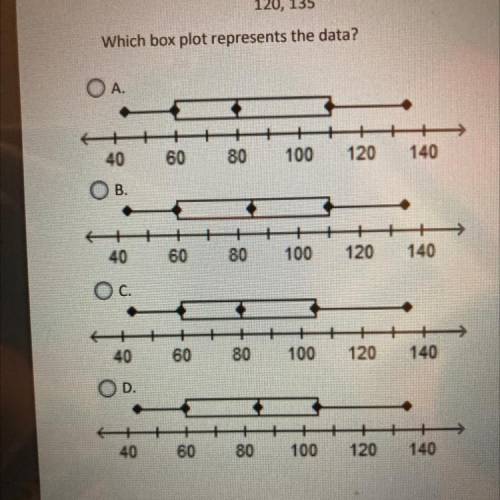
44, 59, 59, 60, 62, 65, 80, 80, 90, 96, 100, 110, 116,
120, 135
Which box plot represents the data?

Answers: 2


Another question on Mathematics
Mathematics, 21.06.2019 19:00
Aflower has 26 chromosomes. to create a new flower,how many would a sperm cell have what is called?
Answers: 1
Mathematics, 21.06.2019 23:30
On this question. a hypothermia occurs when a person's body temperature drops below 95 degrees fahrenheit. write and solve an inequality that describes how much lower the body temperature of a person with hypothermia will be than the body temperature of a person with a normal temperature of 98.6 degrees fahrenheit
Answers: 1
Mathematics, 22.06.2019 00:30
If we pull out the middle player of team a and the fourth player of the team b. what will be the force of team a and team b? what is their sum of forces
Answers: 2
You know the right answer?
Questions


Biology, 26.01.2021 19:10
Mathematics, 26.01.2021 19:10
Chemistry, 26.01.2021 19:10

Biology, 26.01.2021 19:10
Mathematics, 26.01.2021 19:10
Biology, 26.01.2021 19:10
English, 26.01.2021 19:10


