
Mathematics, 12.05.2021 16:40 mybeats12341234
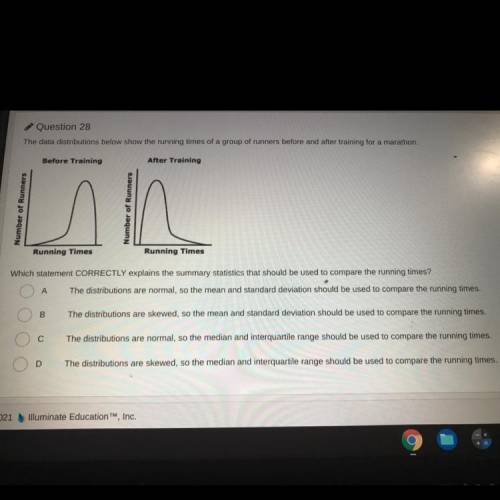
The data distributions below show the running times of a group of runners before and after training for a marathon
Before Training
After Training
Number of Runners
inn
Running Times
Running Times
Which statement CORRECTLY explains the summary statistics that should be used to compare the running times?
A
The distributions are normal, so the mean and standard deviation should be used to compare the running times.
B
The distributions are skewed, so the mean and standard deviation should be used to compare the running times.
С
The distributions are normal, so the median and interquartile range should be used to compare the running times.
D
The distributions are skewed, so the median and interquartile range should be used to compare the running times,

Answers: 3


Another question on Mathematics
Mathematics, 21.06.2019 21:00
Eliza wants to make $10,000 from her investments. she finds an investment account that earns 4.5% interest. she decides to deposit $2,500 into an account. how much money will be in her account after 14 years?
Answers: 1
Mathematics, 21.06.2019 23:10
In which quadrant does the point lie? write the coordinates of the point. a. quadrant ii; (–2, –4) b. quadrant iii; (2, 4) c. quadrant iii; (–2, –4) d. quadrant iv; (–4, –2)
Answers: 3
Mathematics, 22.06.2019 02:00
Suppose you can spend at most $12. create an inequality that represents this restraint. then find at least three ordered pair solutions representing the number of boxes of candy and combos you can buy
Answers: 3
You know the right answer?
The data distributions below show the running times of a group of runners before and after training...
Questions

History, 09.12.2019 15:31
Mathematics, 09.12.2019 15:31
Mathematics, 09.12.2019 15:31
History, 09.12.2019 15:31


History, 09.12.2019 15:31

English, 09.12.2019 15:31

Mathematics, 09.12.2019 15:31
Mathematics, 09.12.2019 15:31
Mathematics, 09.12.2019 15:31


