
Mathematics, 14.05.2021 18:10 aiken11192006
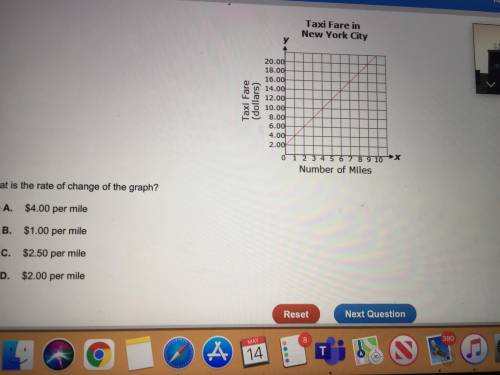
The graph below shows the cost of a taxi in New York City.
What is the rate of change of the graph?
A.
$4.00 per mile
B.
$1.00 per mile
C.
$2.50 per mile
D.
$2.00 per mile

Answers: 1


Another question on Mathematics
Mathematics, 21.06.2019 13:00
Harry’s soccer team plays 2 nonconference games for every 3 games that they play against conference opponents. if y represents the number of nonconference games and x represents the number of conference games, which equation best models this proportional relationship? a)y=2/3 x b)y=3/2 x c)y = 2x d)y = 6x
Answers: 1
Mathematics, 21.06.2019 14:30
Simonne used the following steps to simplify the given expression. 12 - 3(-2x + 4) step 1: 12 + (–3)·(–2x) + (–3)·(4) step 2: 12 + 6x + (–12) step 3: 12 + (–12) + 6x step 4: 0 + 6x step 5: 6x what property of real numbers was used to transition from step 3 to step 4? a. identity property of addition b. inverse property of addition c. associative property of addition d. commutative property of addition
Answers: 1
Mathematics, 21.06.2019 15:30
20 only answer if 100% sure most high school-aged teens are very active. a. true b. false
Answers: 2
Mathematics, 21.06.2019 16:00
Use the function f(x) is graphed below. the graph of the function to find, f(6). -2 -1 1 2
Answers: 1
You know the right answer?
The graph below shows the cost of a taxi in New York City.
What is the rate of change of the graph?...
Questions


Mathematics, 12.12.2019 22:31


