
Mathematics, 24.05.2021 04:30 kenoknox
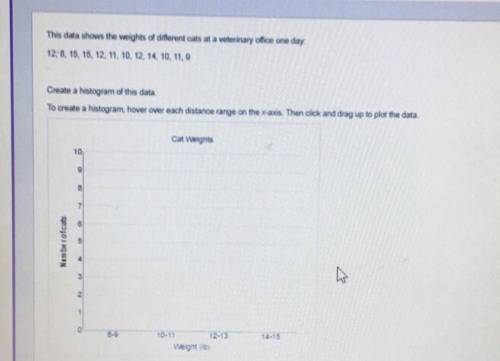
This data shows the weights of different cats at a veterinary office one day:
12, 8, 15, 15, 12, 11, 10, 12, 14, 10, 11, 9
Create a histogram of this data.
To create a histogram, hover over each distance range on the x-axis. Then click and drag up to plot the data.

Answers: 1


Another question on Mathematics
Mathematics, 21.06.2019 17:00
The vet charges $45 for an office visit and $10 for each vaccination your dog needs. write an eaquation
Answers: 1
Mathematics, 21.06.2019 18:30
Tod does not have any cookies. david gives jeff 8 cookies. then he splits half of the cookies he has left with tod. david let’s c represent the number of cookies that he starts with. he finds the number of cookies that tod has is 1/2 the difference of c and 8. write an expression to represent the number of cookies that tod has.
Answers: 2
Mathematics, 21.06.2019 20:00
It is given that the quadratic equation hx²-3x+k=0, where h and k are constants, has roots [tex] \beta \: and \: 2 \beta [/tex]express h in terms of k
Answers: 2
You know the right answer?
This data shows the weights of different cats at a veterinary office one day:
12, 8, 15, 15, 12, 11...
Questions
Mathematics, 30.07.2019 18:20
Mathematics, 30.07.2019 18:20

Computers and Technology, 30.07.2019 18:20

Computers and Technology, 30.07.2019 18:20

Computers and Technology, 30.07.2019 18:20


