
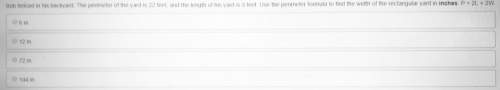
Mathematics, 26.05.2021 22:10 mem8163
The table below represents the function f, and the following graph represents the function g.
x
-6
-4
-2
-1
0
1
(x2)
8
-2
-8 -10 -8
-2
8
22
g
2
2
4
6
2
+
Complete the following statements.
The functions fand g have
The y-intercept of ris
the yintercept of g.
Over the interval [-6, -3), the average rate of change of fis
the average rate of change of g.

Answers: 3


Another question on Mathematics
Mathematics, 21.06.2019 20:50
Samson is going shopping for sugar and butter to make three different kinds of cookies: lemon bars, peanut butter cookies, and sugar cookies. the recipe for lemon bars calls for 2 cups of flour, 2 cups of sugar, and 1 stick of butter. the peanut butter cookie recipe calls for 2 cups of flour, 4 cup of sugar and 2 stick of butter. the sugar cookie recipe calls for 1 cup of flour, 2 cups of sugar, and 2 sticks of butter. sampson has 13 cups of flour at home, and he buys 12 cups (6 pounds) of sugar and 10 sticks of butter. how many batches of each type of cookie can he make? samson can make batches of lemon bars, batches of peanut butter cookies, and batches of 09 cookies submit reset
Answers: 1
Mathematics, 22.06.2019 01:10
Use a standard normal table to determine the probability. give your answer as a decimal to four decimal places. −1.5< < 1.5)
Answers: 3
Mathematics, 22.06.2019 01:30
The box plots show the distributions of the numbers of words per line in an essay printed in two different fonts.which measure of center would be best to compare the data sets? the median is the best measure because both distributions are left-skewed.the mean is the best measure because both distributions are left-skewed.the median is the best measure because both distributions are symmetric.the mean is the best measure because both distributions are symmetric
Answers: 1
You know the right answer?
The table below represents the function f, and the following graph represents the function g.
x
Questions
Mathematics, 20.09.2020 09:01

Physics, 20.09.2020 09:01


Mathematics, 20.09.2020 09:01

Social Studies, 20.09.2020 09:01

Computers and Technology, 20.09.2020 09:01
Computers and Technology, 20.09.2020 09:01
Mathematics, 20.09.2020 09:01
Mathematics, 20.09.2020 09:01


Mathematics, 20.09.2020 09:01


