
Mathematics, 27.05.2021 21:30 Asterisk
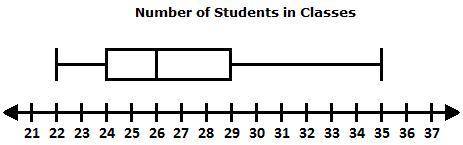
The box plot below shows the number of students in the classes at Scott Middle School.
Identify the best measure of center and the best measure of variability of the data, and identify the values that correspond to those measures.
The best measure of center is the median.
The mean is 28.5.
The best measure of variability is the interquartile range.
The best measure of center is the mean.
The mean absolute deviation is 3.
The median is 26.
The best measure of variability is the mean absolute deviation.
The interquartile range is 5.

Answers: 1


Another question on Mathematics
Mathematics, 21.06.2019 22:00
The sum of the speeds of two trains is 720.2 mph. if the speed of the first train is 7.8 mph faster than the second train, find the speeds of each.
Answers: 1
Mathematics, 21.06.2019 23:30
In the diagram, ab is tangent to c, ab = 4 inches, and ad = 2 inches. find the radius of the circle.
Answers: 2
Mathematics, 21.06.2019 23:40
What is the area of a rectangle with vertices (-8,-2), (-3,-2), (-3,-6), and (-8,-6)? units
Answers: 1
You know the right answer?
The box plot below shows the number of students in the classes at Scott Middle School.
Identify the...
Questions

Chemistry, 25.10.2021 21:40


Mathematics, 25.10.2021 21:40
Mathematics, 25.10.2021 21:40
Chemistry, 25.10.2021 21:40
History, 25.10.2021 21:40

Advanced Placement (AP), 25.10.2021 21:50

Social Studies, 25.10.2021 21:50

English, 25.10.2021 21:50


