Drag the tiles to the correct boxes to complete the pairs.
The graph represents the average c...

Mathematics, 24.06.2021 06:40 sindy35111
Drag the tiles to the correct boxes to complete the pairs.
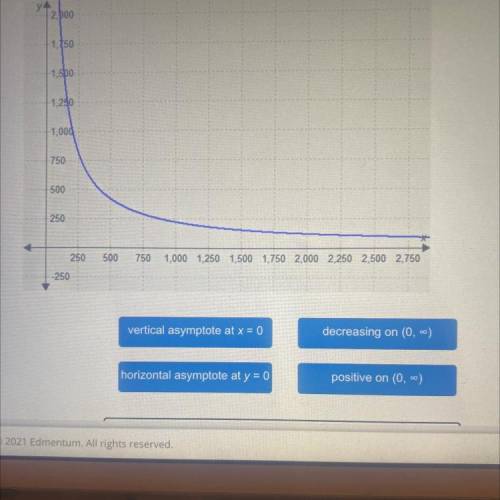
The graph represents the average cost to produce pills, in dollars, as function of the number of pills manufactured by a pharmaceutical company. Match each key feature of function with its interpretation in the scenario.
Box 1: As more pills are produced, the average cost per pill decrease.
Box 2: The cost producing pills can never reach 0.
Box 3: The cost of producing pills cannot be negative.
Box 4: As the number of pills produced gets smaller, the average cost of production greatly increase.

Answers: 1


Another question on Mathematics
Mathematics, 21.06.2019 17:00
Antonia and carla have an equivalant percentage of green marbles in their bags of marbles. antonia has 4 green marbles and 16 total matbles. if carla has 10 green marbles , how many total marbles does carla have
Answers: 1
Mathematics, 21.06.2019 17:00
There is a spinner with 14 equal areas, numbered 1 through 14. if the spinner is spun one time, what is the probability that the result is a multiple of 2 or a multiple of 5?
Answers: 2
Mathematics, 21.06.2019 17:30
Which of the following is true for the relation f(x)=2x^2+1
Answers: 1
You know the right answer?
Questions
Mathematics, 02.11.2020 16:30

English, 02.11.2020 16:30


English, 02.11.2020 16:30


Social Studies, 02.11.2020 16:30

Arts, 02.11.2020 16:30


Physics, 02.11.2020 16:30

History, 02.11.2020 16:30
Mathematics, 02.11.2020 16:30


