
Mathematics, 14.07.2021 22:10 1119diamondlord
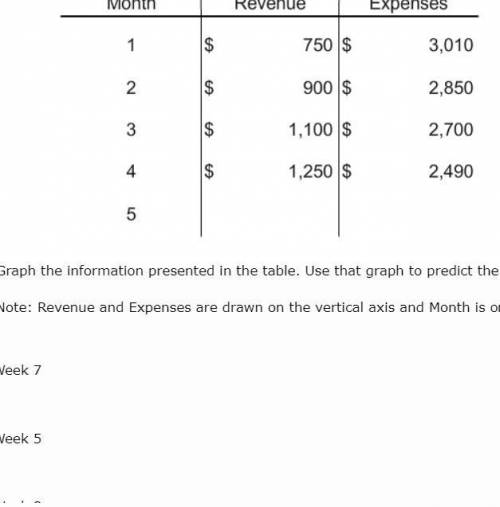
Graph the information presented in the table. Use that graph to predict the week that revenue will equal expenses for this small company.
Note: Revenue and Expenses are drawn on the vertical axis and Month is on the horizontal axis.
Week 7
Week 5
Week 8
Week 6

Answers: 2


Another question on Mathematics
Mathematics, 21.06.2019 22:40
Which of the following circles have their centers on the x-axis? check all that apply.
Answers: 1
Mathematics, 22.06.2019 03:00
I’m how many different ways can she give the four remaining flowers to the rest of the teachers in the afternoon
Answers: 2
Mathematics, 22.06.2019 03:00
Which is the factored form of the polynomial p(x) shown here?
Answers: 1
Mathematics, 22.06.2019 03:30
Aking and his army will attempt to capture a fortress. the left and right flanks break off from the main group to attack the west and east guard towers. suppose the left flank has a 60% chance of success and the right flank has a 75% chance of success, independently of one another. if both flanks capture their respective targets, then the king has a 98% chance of successfully taking the fort. if, however, only the left flank captures its tower, the king has an 80% chance of success; if only the right flank succeeds, the king has a 50% chance. if both flanks fail, then the king's chance of capturing the fort drops to 20%. it turns out the king captures the fort. what is the probability that one, and only one, flank was successful (either the left, or the right, but not both)? (round your answer to 3 decimal places)
Answers: 2
You know the right answer?
Graph the information presented in the table. Use that graph to predict the week that revenue will e...
Questions
Mathematics, 31.01.2021 09:30
Mathematics, 31.01.2021 09:30


Social Studies, 31.01.2021 09:30
Mathematics, 31.01.2021 09:30

English, 31.01.2021 09:30

Mathematics, 31.01.2021 09:30

History, 31.01.2021 09:30


