
Mathematics, 16.07.2021 17:00 jaymoney0531
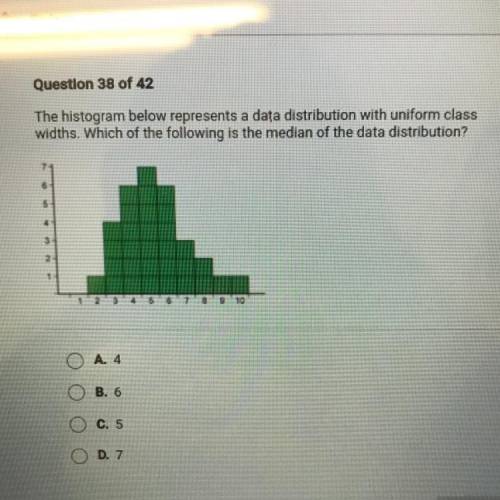
The histogram below represents a data distribution with uniform class
widths. Which of the following is the median of the data distribution?
6
5
4
3
2
1
9 10
A. 4
B. 6
C. 5
c
D. 7

Answers: 3


Another question on Mathematics
Mathematics, 21.06.2019 15:30
On a architect's drawing of a house, 1 inche representa 1.5
Answers: 1
Mathematics, 21.06.2019 17:30
The jewelry store is having a sale. necklaces that were regularly priced at $23.50 are on sale for $18.80. what is the percentage of decrease in the price of necklaces?
Answers: 1
Mathematics, 21.06.2019 17:30
In a probability experiment, karen flipped a coin 76 times. the coin landed on heads 32 times. what percentage of the coin flips resulted in tails? round to the nearest percent. a. 58% b. 65% c. 42% d. 60%
Answers: 2
You know the right answer?
The histogram below represents a data distribution with uniform class
widths. Which of the followin...
Questions


History, 27.07.2019 19:00


English, 27.07.2019 19:00
Mathematics, 27.07.2019 19:00
English, 27.07.2019 19:00
English, 27.07.2019 19:00

Biology, 27.07.2019 19:00
Social Studies, 27.07.2019 19:00
Biology, 27.07.2019 19:00
Social Studies, 27.07.2019 19:00


