
Mathematics, 16.07.2021 19:20 camillaowens206
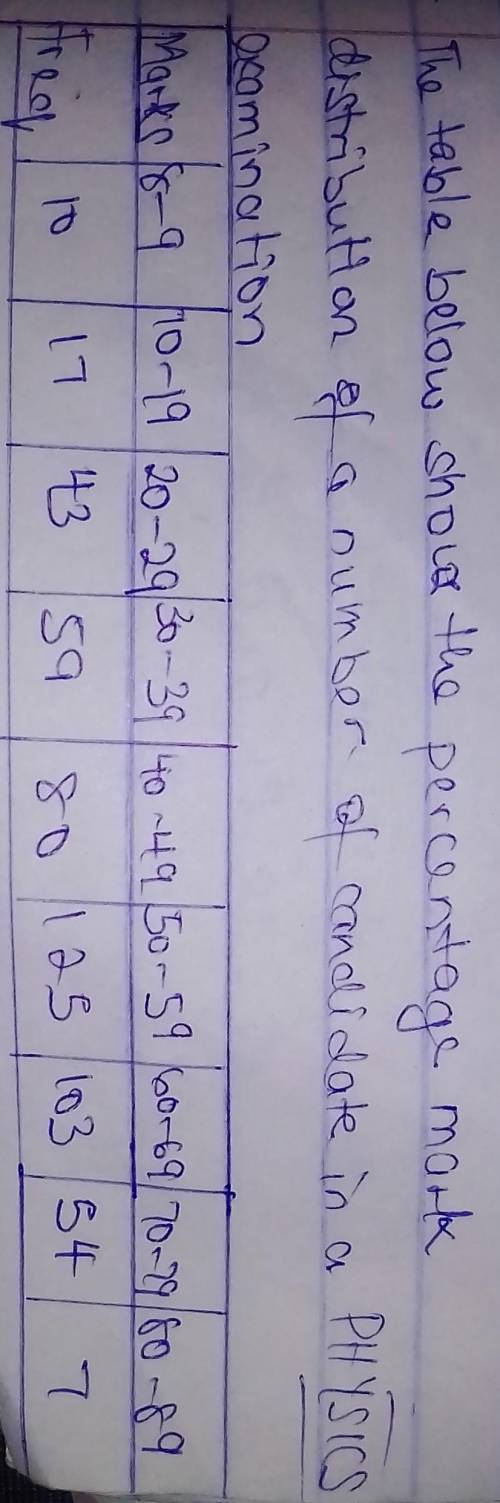
The table below shows the percentage mark distribution of a number of candidates in a physics examination.
The table is in the attached image.
The completion of the table is :
Mark : 90-99
Frequency : 2
1. Make a cumulative frequency table and use it to draw the cumulative frequency curve.
II. from your graph estimate :
a. the Median Mark
b. the number of candidates that passed if the pass mark was 45% .
c. what is the probability that a person chosen at random from the candidates passed the examination.

Answers: 3


Another question on Mathematics
Mathematics, 20.06.2019 18:02
Write 5 numbers that round to 740 when rounded to the nearest 10
Answers: 1
Mathematics, 21.06.2019 14:00
Two sides of a triangle mesure 20cm and 30cm. what is the measure of the third side
Answers: 3
Mathematics, 21.06.2019 18:00
Compare the cost of the bike trips from the two companies shown.for both the cost in a linear function of the number of days which statements is true
Answers: 2
You know the right answer?
The table below shows the percentage mark distribution of a number of candidates in a physics examin...
Questions

Arts, 08.02.2021 22:40

English, 08.02.2021 22:40

History, 08.02.2021 22:40
Mathematics, 08.02.2021 22:40
Mathematics, 08.02.2021 22:40

English, 08.02.2021 22:40

Mathematics, 08.02.2021 22:40

Mathematics, 08.02.2021 22:40
English, 08.02.2021 22:40

Mathematics, 08.02.2021 22:40


