Mathematics, 27.07.2021 06:20 angelina6836
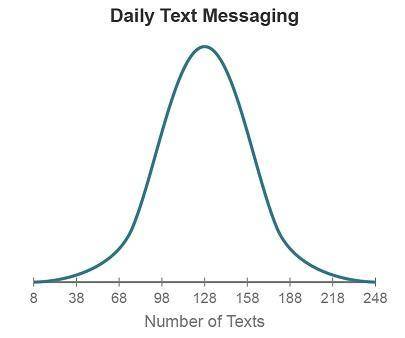
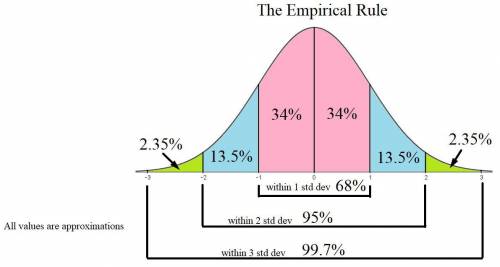
The graph shows the distribution of the number of text messages young adults send per day. The distribution is approximately Normal, with a mean of 128 messages and a standard deviation of 30 messages.
A graph titled daily text messaging has number of text on the x-axis, going from 8 to 248 in increments of 30. Data is distributed normally. The highest point of the curve is at 128.
What percentage of young adults send between 68 and 158 text messages per day?
34%
47.5%
81.5%
95%


Answers: 2


Another question on Mathematics

Mathematics, 21.06.2019 14:50
Name the most appropriate metric unit for each measurement like the mass of cow
Answers: 2


Mathematics, 21.06.2019 15:30
Look at the following graph of the given equation. determine whether the equation is a function. explain why or why not.
Answers: 1

Mathematics, 21.06.2019 20:30
Tom is the deli manager at a grocery store. he needs to schedule employee to staff the deli department for no more that 260 person-hours per week. tom has one part-time employee who works 20 person-hours per week. each full-time employee works 40 person-hours per week. write and inequality to determine n, the number of full-time employees tom may schedule, so that his employees work on more than 260 person-hours per week. graph the solution set to this inequality.
Answers: 1
You know the right answer?
The graph shows the distribution of the number of text messages young adults send per day. The distr...
Questions


Mathematics, 21.11.2019 21:31


Business, 21.11.2019 21:31

History, 21.11.2019 21:31


Social Studies, 21.11.2019 21:31


Geography, 21.11.2019 21:31


