
Mathematics, 10.08.2021 15:10 Hailey1313131313
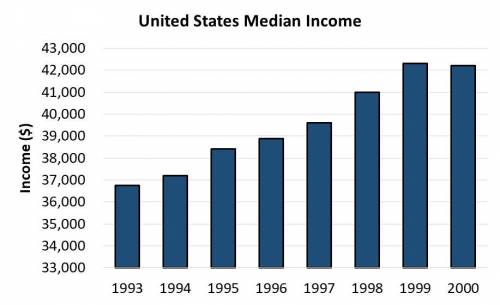
The bar graph shows the median income for families in the United States from 1993 through 2000.
Which two consecutive years saw the largest increase in median income?
A. 1994–1995
B. 1997–1998
C. 1998–1999
D. 1999–2000

Answers: 3


Another question on Mathematics
Mathematics, 21.06.2019 20:30
Daryl factors the polynomial p(x)=x3+x2−26x+24 to rewrite it as p(x)=(x+6)(x−4)(x−1). which equations must be true? there may be more than one correct answer. select all correct answers. p(1)=0 p(−4)=0 p(−1)=0 p(6)=0 p(4)=0 p(−6)=0
Answers: 1
Mathematics, 21.06.2019 22:30
Amachine that produces a special type of transistor (a component of computers) has a 2% defective rate. the production is considered a random process where each transistor is independent of the others. (a) what is the probability that the 10th transistor produced is the first with a defect? (b) what is the probability that the machine produces no defective transistors in a batch of 100? (c) on average, how many transistors would you expect to be produced before the first with a defect? what is the standard deviation? (d) another machine that also produces transistors has a 5% defective rate where each transistor is produced independent of the others. on average how many transistors would you expect to be produced with this machine before the first with a defect? what is the standard deviation? (e) based on your answers to parts (c) and (d), how does increasing the probability of an event a↵ect the mean and standard deviation of the wait time until success?
Answers: 3
Mathematics, 21.06.2019 23:00
Siri can type 90 words in 40 minutes about how many words would you expect her to type in 10 minutes at this rate
Answers: 1
Mathematics, 22.06.2019 01:30
Jacob is graphing the line represented by the equation −6x−5y=12.−6x−5y=12. he first plots the x-x- and y-interceptsy-intercepts as follows. which statement is correct regarding the intercepts on the graph?
Answers: 1
You know the right answer?
The bar graph shows the median income for families in the United States from 1993 through 2000.
Whi...
Questions

Health, 06.09.2019 19:10

Biology, 06.09.2019 19:10


Mathematics, 06.09.2019 19:10
Mathematics, 06.09.2019 19:10
Chemistry, 06.09.2019 19:10

History, 06.09.2019 19:10
History, 06.09.2019 19:10
Biology, 06.09.2019 19:10
History, 06.09.2019 19:10
Mathematics, 06.09.2019 19:10


