
Mathematics, 27.08.2021 09:30 sierrawalk3896
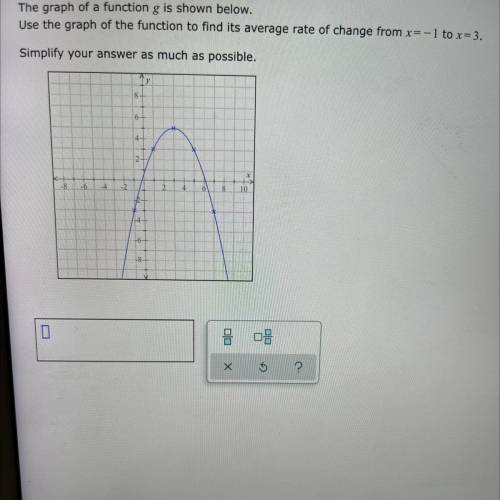
NEED HELP ASAP: WILL MARK BRAINLIEST: The graph of a function g is shown below.
Use the graph of the function to find its average rate of change from x=-1 to x=3.
Simplify your answer as much as possible.

Answers: 1


Another question on Mathematics
Mathematics, 21.06.2019 17:30
Write the fraction 9/50 as a decimal if needed round to the nearest hundredth
Answers: 2
Mathematics, 21.06.2019 17:50
F(x) = x2 − 9, and g(x) = x − 3 f(x) = x2 − 4x + 3, and g(x) = x − 3 f(x) = x2 + 4x − 5, and g(x) = x − 1 f(x) = x2 − 16, and g(x) = x − 4 h(x) = x + 5 arrowright h(x) = x + 3 arrowright h(x) = x + 4 arrowright h(x) = x − 1 arrowright
Answers: 2
Mathematics, 21.06.2019 19:50
The graph shows the distance kerri drives on a trip. what is kerri's speed?
Answers: 3
Mathematics, 21.06.2019 20:30
Find the solution(s) to the system of equations. select all that apply y=x^2-1 y=2x-2
Answers: 2
You know the right answer?
NEED HELP ASAP: WILL MARK BRAINLIEST: The graph of a function g is shown below.
Use the graph of t...
Questions


Computers and Technology, 16.04.2020 03:03
Computers and Technology, 16.04.2020 03:03
Mathematics, 16.04.2020 03:03
Computers and Technology, 16.04.2020 03:03


Chemistry, 16.04.2020 03:03
Mathematics, 16.04.2020 03:03
Mathematics, 16.04.2020 03:03

Biology, 16.04.2020 03:03


