
Mathematics, 09.09.2021 05:20 haleyllevsen
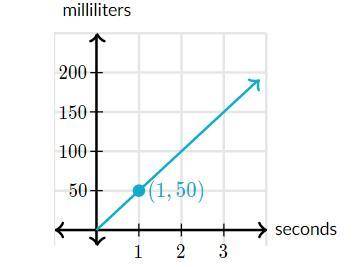
The graph shows the relationship between the volume of coffee in a cup and the length of time Cassie pours coffee into the cup. What does 50 mean in this situation? I need some help on this question because my math teacher decided to not tell us how to do any of the work he assigned.

Answers: 3


Another question on Mathematics
Mathematics, 21.06.2019 15:00
Ahigh school has 3636 players on the football team. the summary of the players' weights is given in the box plot. approximately, what is the percentage of players weighing less than or equal to 225225 pounds?
Answers: 2
Mathematics, 21.06.2019 19:00
At $1.32 million, they closed last month percent above what they paid in 2007." how much did they pay in 2007?
Answers: 1
Mathematics, 21.06.2019 19:00
Which shows the correct substitution of the values a,b and c from the equation 1=-2x+3x^2+1
Answers: 1
Mathematics, 21.06.2019 22:30
1.based of the diagrams what is the the value of x? 2.how would you verify your answer for x
Answers: 1
You know the right answer?
The graph shows the relationship between the volume of coffee in a cup and the length of time Cassie...
Questions


Mathematics, 31.03.2020 00:12

Mathematics, 31.03.2020 00:12
Mathematics, 31.03.2020 00:12


