
Mathematics, 13.12.2021 16:30 kimlyn58p0wyn0
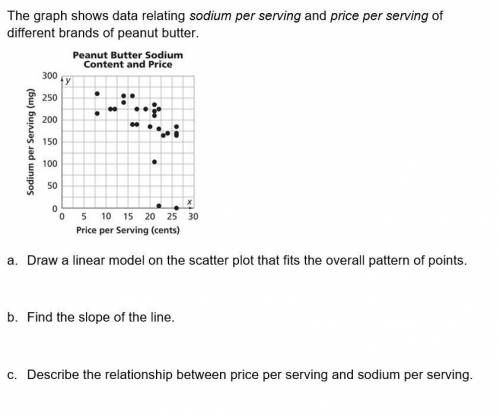
the graph shows data relating sodium per serving and price per serving of different brands of peanut butter, Using this model, predict the amount of sodium in Peanut Butter that costs $.35 per serving.

Answers: 3


Another question on Mathematics
Mathematics, 21.06.2019 17:30
Mrs. morton has a special reward system for her class. when all her students behave well, she rewards them by putting 3 marbles into a marble jar. when the jar has 100 or more marbles, the students have a party. right now, the the jar has 24 marbles. how could mrs. morton reward the class in order for the students to have a party?
Answers: 3
Mathematics, 21.06.2019 23:30
Darren earned $663.26 in net pay for working 38 hours. he paid $118.51 in federal and state income taxes, and $64.75 in fica taxes. what was darren's hourly wage? question options: $17.45 $19.16 $20.57 $22.28
Answers: 3
Mathematics, 22.06.2019 02:30
The upcoming championship high school football game is a big deal in your little town. the problem is, it is being played in the next biggest town, which is two hours away! to get as many people as you can to attend the game, you decide to come up with a ride-sharing app, but you want to be sure it will be used before you put all the time in to creating it. you determine that if more than three students share a ride, on average, you will create the app. you conduct simple random sampling of 20 students in a school with a population of 300 students to determine how many students are in each ride-share (carpool) on the way to school every day to get a good idea of who would use the app. the following data are collected: 6 5 5 5 3 2 3 6 2 2 5 4 3 3 4 2 5 3 4 5 construct a 95% confidence interval for the mean number of students who share a ride to school, and interpret the results. part a: state the parameter and check the conditions. part b: construct the confidence interval. be sure to show all your work, including the degrees of freedom, critical value, sample statistics, and an explanation of your process. part c: interpret the meaning of the confidence interval. part d: use your findings to explain whether you should develop the ride-share app for the football game.
Answers: 3
Mathematics, 22.06.2019 03:00
The formula for finding volume of a cone 1/3pi x r^2h. the volume of a cone is 300 cm^3 and the height of the cone is 10 what is the approximate radius of the cone
Answers: 1
You know the right answer?
the graph shows data relating sodium per serving and price per serving of different brands of peanut...
Questions

Computers and Technology, 23.08.2019 17:10


Computers and Technology, 23.08.2019 17:10
Engineering, 23.08.2019 17:10

Social Studies, 23.08.2019 17:10


Mathematics, 23.08.2019 17:10


