
Mathematics, 10.02.2022 14:00 SmokeyRN
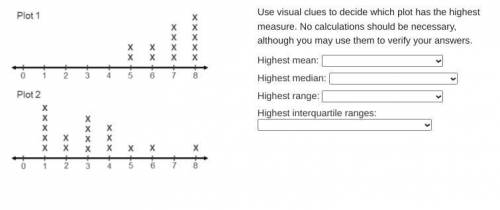
Plot 1 goes from 0 to 8. There are 2 images above 5, 2 above 6, 4 above 7, and 5 above 8. Plot 2 goes from 0 to 8. there are 5 images above 1, 2 images above 2, 4 images above 3, 3 images above 4, 1 image above 5, 1 image above 6, and 1 image above 8.
Use visual clues to decide which plot has the highest measure. No calculations should be necessary, although you may use them to verify your answers.
Highest mean:
Highest median:
Highest range:
Highest interquartile ranges:

Answers: 3


Another question on Mathematics
Mathematics, 21.06.2019 20:30
Write the summation to estimate the area under the curve y = 1 + x2 from x = -1 to x = 2 using 3 rectangles and right endpoints
Answers: 1
Mathematics, 22.06.2019 01:50
Quadrilateral ghij has coordinates g(5, 1), h(4, -3), i(6, -1), and j(2, 1). if the quadrilateral is reflected over the line y = x, what are the coordinates of h'?
Answers: 1
Mathematics, 22.06.2019 04:00
Identify reflection rule on a coordinate plane that verifies that triangle a(-1,7), b(6,5), c(-2,2) and a’(-1,-7), b(6,-5), c’(-2,2) triangle are congruent when reflected over the x-axis
Answers: 1
You know the right answer?
Plot 1 goes from 0 to 8. There are 2 images above 5, 2 above 6, 4 above 7, and 5 above 8. Plot 2 goe...
Questions


Computers and Technology, 18.03.2020 13:30


Biology, 18.03.2020 13:33
Biology, 18.03.2020 13:33
Biology, 18.03.2020 13:38


English, 18.03.2020 13:52
Mathematics, 18.03.2020 13:52

French, 18.03.2020 13:53
French, 18.03.2020 14:02
Mathematics, 18.03.2020 14:04

Geography, 18.03.2020 14:04


