
Mathematics, 16.02.2022 09:10 angie249
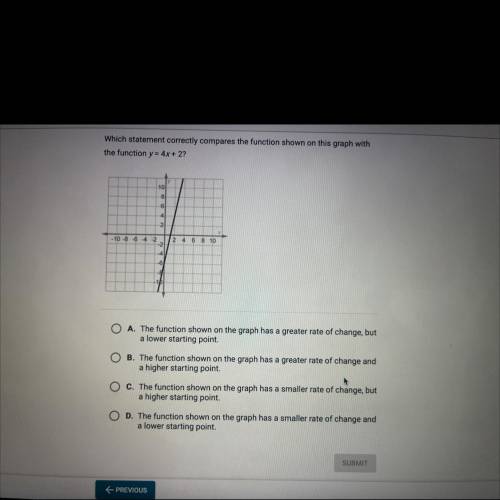
Which statement correctly compares the function shown on this graph with
the function y = 4x + 2?
10
8
6
4
2.
- 10 -8 -6 42
-2
2 4 6 8 10
N
-4
-6
-
-11
A. The function shown on the graph has a greater rate of change, but
a lower starting point.
B. The function shown on the graph has a greater rate of change and
a higher starting point.
C. The function shown on the graph has a smaller rate of change, but
a higher starting point.
D. The function shown on the graph has a smaller rate of change and
a lower starting point.

Answers: 3


Another question on Mathematics
Mathematics, 21.06.2019 12:50
Plz, ! the box plot below shows the total amount of time, in minutes, the students of a class surf the internet every day: a box plot is shown.part a: list two pieces of information that are provided by the graph and one piece of information that is not provided by the graph. (4 points) part b: calculate the interquartile range of the data, and explain in a sentence or two what it represents. (4 points) part c: explain what affect, if any, there will be if an outlier is present. (2 points)
Answers: 3
Mathematics, 21.06.2019 14:30
Because of your favorite lemonade it is $3.84 for 3 gallons. write this as an unit rate
Answers: 2
You know the right answer?
Which statement correctly compares the function shown on this graph with
the function y = 4x + 2?<...
Questions


Biology, 04.03.2021 19:40

Mathematics, 04.03.2021 19:40

History, 04.03.2021 19:40

Mathematics, 04.03.2021 19:40
Mathematics, 04.03.2021 19:40

Chemistry, 04.03.2021 19:40
Mathematics, 04.03.2021 19:40
History, 04.03.2021 19:40
Mathematics, 04.03.2021 19:40
Chemistry, 04.03.2021 19:40


