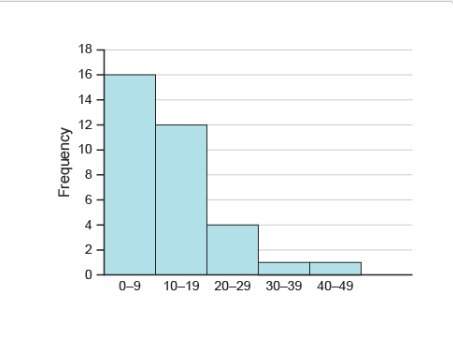
Which description best fits the distribution of the data shown in the histogram?
a. ske...

Mathematics, 14.10.2019 13:10 sophiebeardsley94
Which description best fits the distribution of the data shown in the histogram?
a. skewed left
b. uniform
c. skewed right
d. approximately bell-shaped

Answers: 1


Another question on Mathematics
Mathematics, 21.06.2019 16:00
Which rational number could be graphed between -4 and -5
Answers: 1
Mathematics, 21.06.2019 19:10
The linear combination method is applied to a system of equations as shown. 4(.25x + .5y = 3.75) → x + 2y = 15 (4x – 8y = 12) → x – 2y = 3 2x = 18 what is the solution of the system of equations? (1,2) (3,9) (5,5) (9,3)
Answers: 1
Mathematics, 21.06.2019 22:30
Find the condition that the zeros of the polynomial f(x) = x^3+3px^2+3px+r may be in a.p.
Answers: 1
You know the right answer?
Questions


History, 23.08.2019 20:40
Mathematics, 23.08.2019 20:40

Social Studies, 23.08.2019 20:40
Mathematics, 23.08.2019 20:40


Mathematics, 23.08.2019 20:40
Mathematics, 23.08.2019 20:40
English, 23.08.2019 20:40
Mathematics, 23.08.2019 20:40


