
Mathematics, 19.12.2019 16:31 ninjapig647
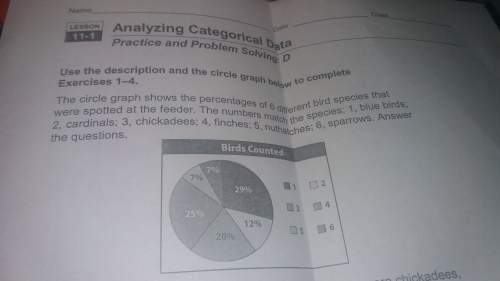
The circle graph shows the percentage of six different bird species that were spotted in the bird feeder the number matches species were one bluebirds. 2 cardinals .3 chickadees 4 finches 5 nuthatches 6 sparrow.
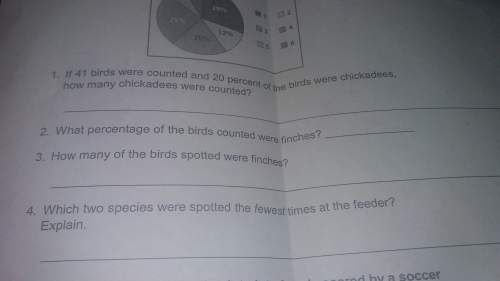
1. if 41 birds were counted and 20% of the birds were chickadees how many chickadees were counted?
2. what percentage of birds counted were finches
3. how many is a bird were spotted were finches
4. which two species were spotted the fewest times at the feeder explain

Answers: 3


Another question on Mathematics
Mathematics, 21.06.2019 14:00
Use the knowledge of x- and y- intercepts to choose the correct graph of the equation 3x+6y=6
Answers: 1
Mathematics, 21.06.2019 20:00
Ialready asked this but i never got an answer. will give a high rating and perhaps brainliest. choose the linear inequality that describes the graph. the gray area represents the shaded region. y ≤ –4x – 2 y > –4x – 2 y ≥ –4x – 2 y < 4x – 2
Answers: 1
Mathematics, 21.06.2019 22:00
Manuela claims that and are congruent. which statement best describes her claim? she is incorrect because the segments do not have the same orientation. she is incorrect because the segments do not have the same length. she is correct because the segments have the same length. she is correct because the segments have the same orientation.
Answers: 1
You know the right answer?
The circle graph shows the percentage of six different bird species that were spotted in the bird fe...
Questions

French, 15.04.2021 01:00


Mathematics, 15.04.2021 01:00
History, 15.04.2021 01:00

Mathematics, 15.04.2021 01:00
History, 15.04.2021 01:00

Social Studies, 15.04.2021 01:00

English, 15.04.2021 01:00
Physics, 15.04.2021 01:00


