
Mathematics, 27.07.2019 00:00 gunner20115
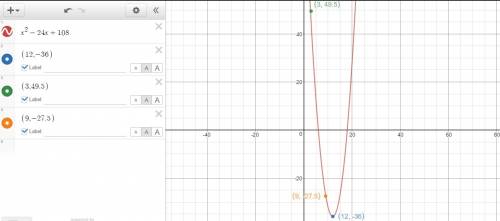
The graph below shows the value of edna's profits f(t), in dollars, after t months: graph of quadratic function f of t having x intercepts at 6, 0 and 18, 0 and vertex at 12, negative 36 and passes through 3, 49.5 and 9, negative 27.25 what is the closest approximate average rate of change for edna's profits from the 3rd month to the 9th month? a. −69.75 dollars per month b. −11.63 dollars per month c. six dollars per month d. nine dollars per month (i think it's c but i'm not sure)

Answers: 2
 and
and  are the zeroes of our quadratic. To find our quadratic we are going to factor each zero backwards and multiply them:


 is the function evaluated at the 9th month
 is the function evaluated at the 3rd month
 ![m= \frac{[9^{2}-24(9)+108]-[3^{2}-24(3)+108]}{9-3}](/tpl/images/0136/8097/b0449.png)


Another question on Mathematics
Mathematics, 20.06.2019 18:02
The total number of students in gina’s after-school program is .the number of students who have 4 or more siblings is .reset next
Answers: 2
Mathematics, 21.06.2019 15:30
Afruit stand has to decide what to charge for their produce. they need $10 for 4 apples and 4 oranges. they also need $15 for 6 apples and 6 oranges. we put this information into a system of linear equations. can we find a unique price for an apple and an orange?
Answers: 2
You know the right answer?
The graph below shows the value of edna's profits f(t), in dollars, after t months: graph of quadr...
Questions
Mathematics, 30.07.2019 10:40


Mathematics, 30.07.2019 10:40
Mathematics, 30.07.2019 10:40


Social Studies, 30.07.2019 10:40

Computers and Technology, 30.07.2019 10:40
History, 30.07.2019 10:40

Spanish, 30.07.2019 10:40


