
Physics, 26.08.2020 20:01 kendratorres200
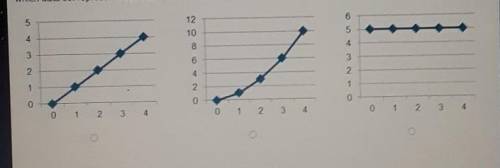
The graphs display velocity data Velocity is on the y-axis (m/s), while time is on the x-axis (s). Based on the graphs, which data set represents constant acceleration?

Answers: 3


Another question on Physics
Physics, 21.06.2019 17:00
Ajogger accelerates from rest to 4.86 m/s in 2.43 s. a car accelerates from 20.6 to 32.7 m/s also in 2.43 s. (a) find the magnitude of the acceleration of the jogger. (b) determine the magnitude of the acceleration of the car. (c) how much further does the car travel than the jogger during the 2.43 s?
Answers: 2
Physics, 22.06.2019 12:30
Write a full page that sumerizes thermodynamics it’s from the website visionlearnig
Answers: 1
Physics, 22.06.2019 16:30
Select all the correct answers. which three statements about electromagnetic radiation are true?
Answers: 3
You know the right answer?
The graphs display velocity data Velocity is on the y-axis (m/s), while time is on the x-axis (s). B...
Questions


Mathematics, 21.02.2020 02:56


Biology, 21.02.2020 02:56
Mathematics, 21.02.2020 02:56
Mathematics, 21.02.2020 02:56


