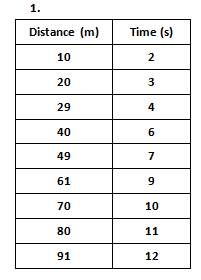
Graph the following set of data using proper graphing techniques.
step 1. label horizontal (x)...

Physics, 22.08.2019 11:10 briannamoreno12353
Graph the following set of data using proper graphing techniques.
step 1. label horizontal (x) axis and vertical (y) axis correctly.
step 2. plot pair of values from data table (x and y). you may use the calculator function stat, edit.
step 3. draw a light “line of best fit”. do not connect dots! you may use the calculator function stat, calc.
a. what kind of curve did you obtain?
b. what is the relationship between the variables?
c. what do you expect the distance traveled to be after 45 s?
d. how much time is required for the object to travel 74 m?

Answers: 1


Another question on Physics
Physics, 21.06.2019 17:10
Aseries circuit consists of a resistor with r = 20 ? , a capacitor with c = 0.01 f, and a decaying battery with e = 300e? 5t. if the initial charge is 0, find the charge as a function of time t
Answers: 2
Physics, 22.06.2019 15:40
If an electric circuit is not grounded it is best to reach out and touch it to provide the ground a.true or b.false
Answers: 2
Physics, 23.06.2019 02:30
Aprotein molecule in an electrophoresis gel has a negative charge.the exact charge depends on the ph of the solution, but 30 excesselectrons is typical. what is the magnitude of the electric forceon a protein with this charge in a 1500 n/c electric field?
Answers: 3
Physics, 23.06.2019 05:30
What are the differences and relationships between speed, velocity, and acceleration
Answers: 1
You know the right answer?
Questions


Business, 06.07.2019 13:50
Mathematics, 06.07.2019 13:50
Mathematics, 06.07.2019 13:50

Biology, 06.07.2019 13:50

Spanish, 06.07.2019 13:50
Mathematics, 06.07.2019 13:50

English, 06.07.2019 13:50
Mathematics, 06.07.2019 13:50
Mathematics, 06.07.2019 13:50

Chemistry, 06.07.2019 13:50
English, 06.07.2019 13:50


