Social Studies, 05.03.2021 17:40 malachijwilson5
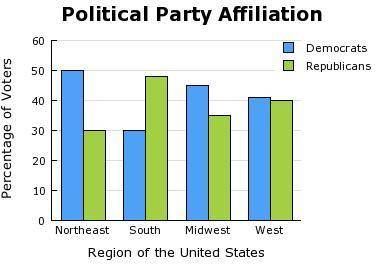
This bar graph would be MOST useful in a report about
A) how political parties change over time.
B) why people change their party affiliation.
C) how the South consistently votes Democratic.
D) why conservative legislation fails in the Northeast.


Answers: 2


Another question on Social Studies

Social Studies, 21.06.2019 21:30
Fulton county would be most likely to have its economy positively influenced bya) an international airport. b) the port of brunswick. c) the port of savannah. d) a subway system
Answers: 1

Social Studies, 21.06.2019 23:00
What is the most common way for americans to receive their news?
Answers: 1

Social Studies, 22.06.2019 00:00
Read the sentence below, then answer the question that follows. penny learned tolerance after rahj explained the traditions of his family and their practice of indian traditions. the underlined word in the sentence above can best be defined as a. a fair and understanding view of those whose culture, race, or nationality differs from one’s own b. an understanding of a set of organized beliefs and practices that are often centered around one or more deities c. the linking of a group of people based on common characteristics such as culture, beliefs, or common history d. a classification based on inherited physical or biological traits
Answers: 1

Social Studies, 22.06.2019 13:30
Dried paste made of boiled beef cow hooves eggs and vegtables what soup
Answers: 3
You know the right answer?
This bar graph would be MOST useful in a report about
A) how political parties change over time.
Questions

Mathematics, 13.07.2019 20:30


English, 13.07.2019 20:30

Social Studies, 13.07.2019 20:30

Mathematics, 13.07.2019 20:30


Mathematics, 13.07.2019 20:30

Mathematics, 13.07.2019 20:30


Mathematics, 13.07.2019 20:30


Mathematics, 13.07.2019 20:30


