
Mathematics, 22.11.2019 20:31 xojade
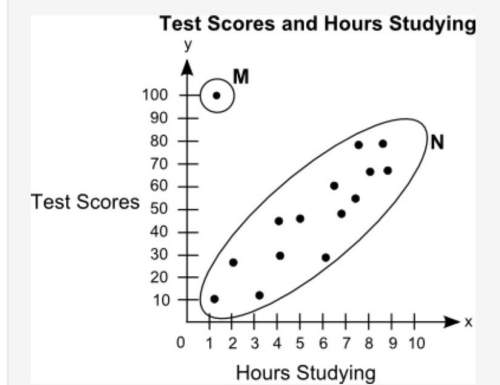
the scatter plot shows the relationship between the test scores of a group of students and the number of hours they study in a week:
on a grid, label hours studying on x axis and test scores on y axis. the title of the graph is test scores and hours studying. the scale on the x axis shows the numbers from 0 to 10 at increments of 1, and the scale on the y axis shows numbers from 0 to 100 at increments of 10. dots are made at the ordered pairs 1.1, 10 and 2, 25 and 3.1, 10.1 and 4, 30 and 4, 45 and 5, 45 and 6, 25 and 6.5, 60 and 7, 45 and 7.5, 50 and 7.5, 75 and 8, 60 and 8.5, 75 and 9, 60. the ordered pair 1, 100 is circled and labeled as m. all the other points are put in an oval and labeled as n.
part a: what is the group of points labeled n called? what is the point labeled m called? give a possible reason for the presence of point m. (5 points)
part b: describe the association between students' test scores and the number of hours they study. (5 points)

Answers: 3


Another question on Mathematics
Mathematics, 21.06.2019 20:00
1: 4 if the wew 35 surfboards at the beach how many were short boards?
Answers: 1
Mathematics, 21.06.2019 20:30
Solve this riddle: i am an odd number. i an less than 100. the some of my digit is 12. i am a multiple of 15. what number am i?
Answers: 1
Mathematics, 22.06.2019 00:00
Macy spent $36 on jeans. this was $12 less than twice what she spent on a shirt. which equation to solve this, 12x=36 2x=36-12 2x-12=36 12-2x=36
Answers: 1
You know the right answer?
the scatter plot shows the relationship between the test scores of a group of students and the numbe...
Questions


Physics, 23.03.2020 18:53

Mathematics, 23.03.2020 18:53
Mathematics, 23.03.2020 18:54

English, 23.03.2020 18:54


