
Mathematics, 08.02.2021 17:10 cchavcchav9606
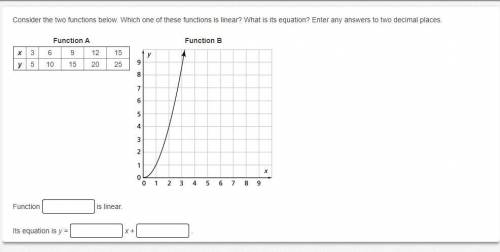
Consider the two functions below. Which one of these functions is linear? What is its equation? Enter any answers to two decimal places.

Answers: 1


Another question on Mathematics
Mathematics, 21.06.2019 19:30
Select the margin of error that corresponds to the sample mean that corresponds to each population: a population mean of 25, a standard deviation of 2.5, and margin of error of 5%
Answers: 2
Mathematics, 22.06.2019 00:20
Does the construction demonstrate how to copy an angle correctly using technology a) yes the distance between points a and f was used to create circle h b) yes the distance between points f and g was used to create circle h c) no the distance between points a and f was used to create circle h d) no the distance between points f and g was used to create circle h
Answers: 3
Mathematics, 22.06.2019 00:30
Abcd is reflected across the x- axis, then rotated 90 clockwise about the orgin, and finally reflected across the line y= x to form a’ b’ c’ .
Answers: 2
Mathematics, 22.06.2019 02:30
Atrain traveled for 1.5 hours to the first station, stopped for 30 minutes, then traveled for 4 hours to the final station where it stopped for 1 hour. the total distance traveled is a function of time. which graph most accurately represents this scenario? a graph is shown with the x-axis labeled time (in hours) and the y-axis labeled total distance (in miles). the line begins at the origin and moves upward for 1.5 hours. the line then continues upward at a slow rate until 2 hours. from 2 to 6 hours, the line continues quickly upward. from 6 to 7 hours, it moves downward until it touches the x-axis a graph is shown with the axis labeled time (in hours) and the y axis labeled total distance (in miles). a line is shown beginning at the origin. the line moves upward until 1.5 hours, then is a horizontal line until 2 hours. the line moves quickly upward again until 6 hours, and then is horizontal until 7 hours a graph is shown with the axis labeled time (in hours) and the y-axis labeled total distance (in miles). the line begins at the y-axis where y equals 125. it is horizontal until 1.5 hours, then moves downward until 2 hours where it touches the x-axis. the line moves upward until 6 hours and then moves downward until 7 hours where it touches the x-axis a graph is shown with the axis labeled time (in hours) and the y-axis labeled total distance (in miles). the line begins at y equals 125 and is horizontal for 1.5 hours. the line moves downward until 2 hours, then back up until 5.5 hours. the line is horizontal from 5.5 to 7 hours
Answers: 1
You know the right answer?
Consider the two functions below. Which one of these functions is linear? What is its equation? Ente...
Questions
Mathematics, 06.07.2019 07:50
Mathematics, 06.07.2019 07:50

Health, 06.07.2019 07:50


Chemistry, 06.07.2019 07:50


Mathematics, 06.07.2019 07:50

Social Studies, 06.07.2019 07:50
Mathematics, 06.07.2019 07:50
Mathematics, 06.07.2019 07:50


