The box-and-whisker plot shows the
number of miles run per week by the
members of a running...

Mathematics, 30.04.2021 06:00 bcox32314
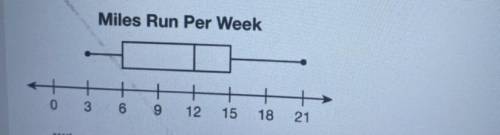
The box-and-whisker plot shows the
number of miles run per week by the
members of a running club.
What is the range of the data?

Answers: 2


Another question on Mathematics
Mathematics, 21.06.2019 13:20
Using the graph below, select all statements that are true. a. f(0.6)=0 b. f(-3.2)=-3 c. f(5.1)=5 d. this is the graph of the greatest integer function. e. this graph is one-to-one.
Answers: 1
Mathematics, 21.06.2019 21:00
Ireally need subtract and simplify.(-y^2 – 4y - 8) – (-4y^2 – 6y + 3)show your work, ! i will mark you brainliest but you have to show your work.
Answers: 1
Mathematics, 21.06.2019 23:30
Solve this 364x-64x=300x and 12(x2–x–1)+13(x2–x–1)=25(x2–x–1)
Answers: 1
Mathematics, 22.06.2019 02:00
Rachel is studying the population of a particular bird species in a national park. she observes every 10th bird of that species that she can find in the park. her conclusion is that the birds living in the park who belong to that species generally feed on insects. rachel's sample is . based on the sample she picked, rachel's generalization is
Answers: 2
You know the right answer?
Questions


Mathematics, 28.07.2019 10:30

Chemistry, 28.07.2019 10:30

Social Studies, 28.07.2019 10:30
Biology, 28.07.2019 10:30

English, 28.07.2019 10:30
English, 28.07.2019 10:30
Chemistry, 28.07.2019 10:30
Social Studies, 28.07.2019 10:30
Mathematics, 28.07.2019 10:30


