Mathematics, 08.02.2021 16:00 lindirogers19
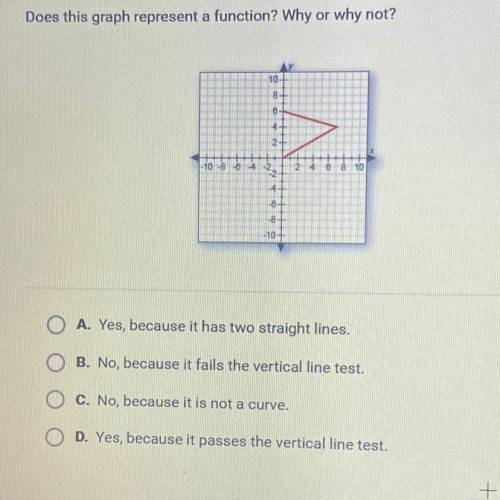
Does this graph represent a function? Why or why not?
104
8
8
4
2-
2
1-10 8 6 4 2
810
4
-8
-8-
-10
A. Yes, because it has two straight lines.
0
B. No, because it fails the vertical line test.
0
C. No, because it is not a curve.
D. Yes, because it passes the vertical line test.


Answers: 3


Another question on Mathematics

Mathematics, 21.06.2019 13:30
Factorize: x^2+8x+10 i just solved it but i don't know if the process is correct
Answers: 3

Mathematics, 21.06.2019 19:30
If you can solve all of these i will give ! - 4% of 190 - 4% of 162.5 - 4% of 140 - a 4% increase from 155.1 - a 4% increase from 159.8
Answers: 2

Mathematics, 21.06.2019 20:50
Type the correct answer in each box, round your answers to the nearest integer 20 25 30 in the figure, the perimeter of hexagon abcdef is approximately w units, and its area is square units
Answers: 3

Mathematics, 22.06.2019 00:50
Astudent is determining the influence of different types of food on the growth rate of spiders. she feeds one group of spiders two caterpillars twice a week. the other group received similarly-sized beetles twice a week. she records the amount of time required for individuals to reach sexual maturity. her hypothesis is that the spiders feeding on caterpillars will have a faster growth rate because caterpillars have a higher protein content compared to beetles. in this experiment, what is the dependent variable? spiders assigned to different feeding groups. time required to reach sexual maturity number of prey items fed twice a week. growth rates of each group.
Answers: 2
You know the right answer?
Does this graph represent a function? Why or why not?
104
8
8
4
2-
2<...
8
8
4
2-
2<...
Questions


Mathematics, 26.08.2019 20:00


Biology, 26.08.2019 20:00


Computers and Technology, 26.08.2019 20:00


Biology, 26.08.2019 20:00


